Slope of a Graph in Physics: What Rise Over Run Actually Tells You
You're standing at the lab bench with a velocity-time graph your group just plotted from a cart rolling down a track. The teacher asks for the acceleration. There's no acceleration printed anywhere on the page — but it's hiding in plain sight, in the steepness of the line. That steepness is the slope, and on this particular graph the slope is the acceleration. Learning to pull a physical quantity out of a line is one of the most reused skills in all of physics, and it always comes down to the same two words: rise over run.
Start With a Real Graph: Reading Acceleration off a Line
Say your cart's velocity-time graph passes cleanly through the point (2 s, 4 m/s) and later through (6 s, 20 m/s). To get the acceleration you take the change in velocity divided by the change in time: (20 − 4) / (6 − 2) = 16 / 4 = 4 m/s². That's it. The cart speeds up by 4 metres per second every second. Notice we didn't need the formula a = (v − u) / t in any disguised form — it's literally the slope of the line.
The single most important habit here is choosing points that are far apart. If you'd instead read (3 s, 8 m/s) and (3.5 s, 10 m/s), a half-millimetre misread on the graph could swing your run from 0.5 to 0.4 and throw the slope off by 25%. Picking points four seconds apart makes the same reading error almost invisible. This is why examiners award method marks for drawing a large slope triangle.
Rise Over Run, and Why the Units Do the Heavy Lifting
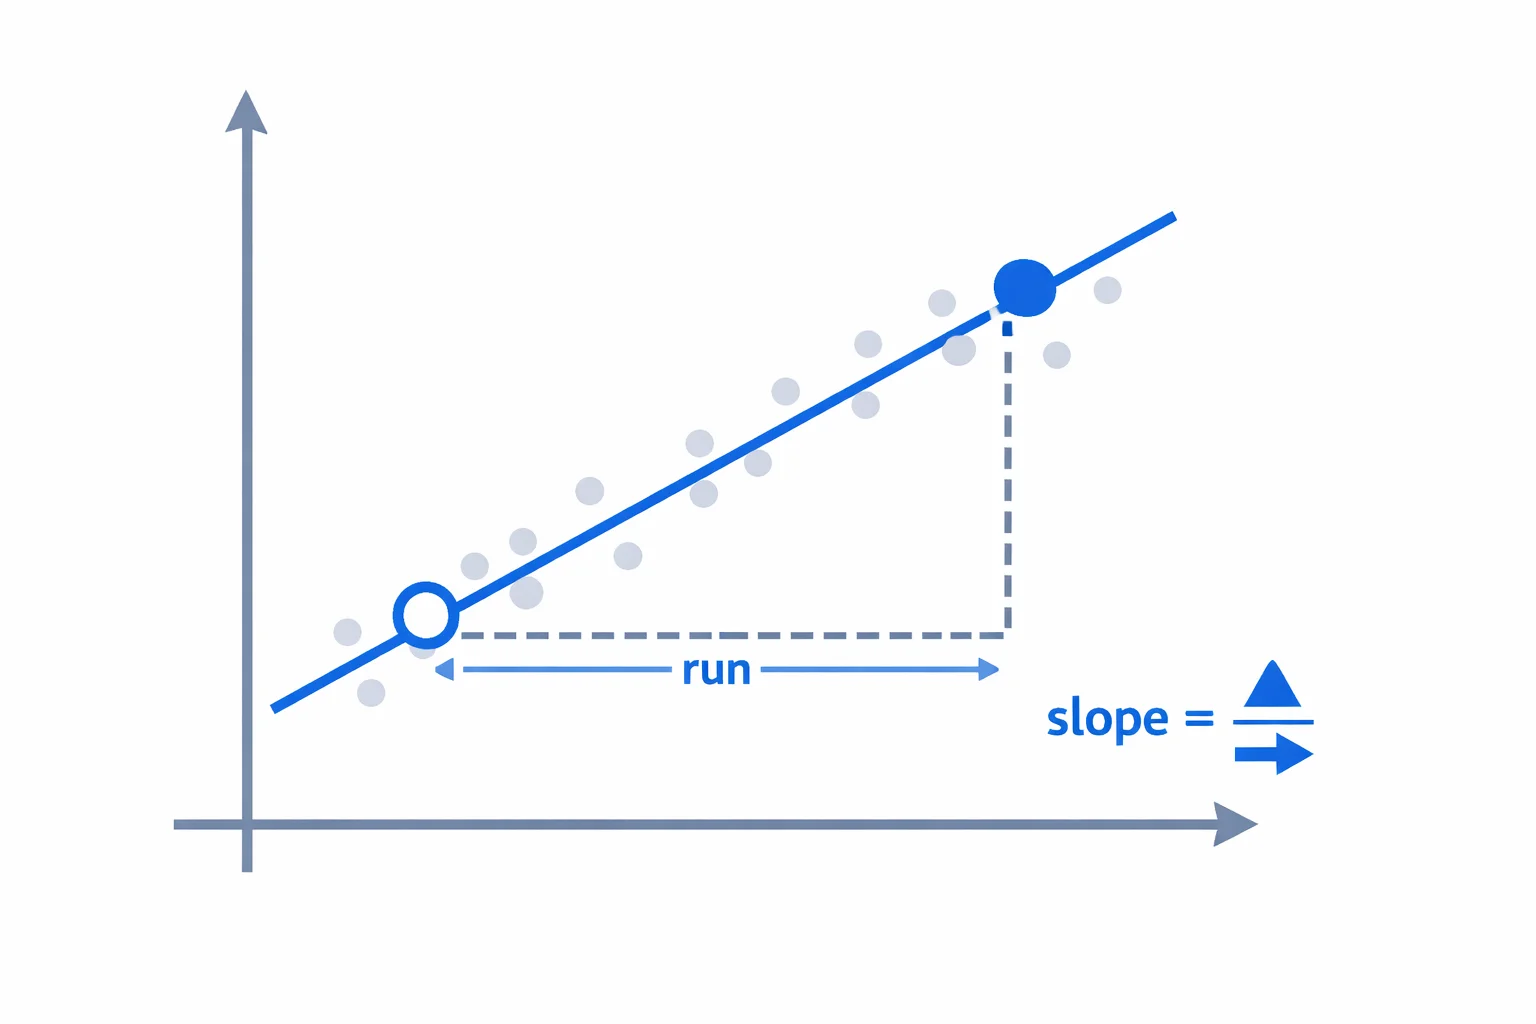
The formula never changes: slope = (y₂ − y₁) / (x₂ − x₁). Rise is the vertical change, run is the horizontal change. What changes from graph to graph is what those axes are— and that's where the physics lives. The units of the slope are always “y-units per x-units,” and if you track them honestly, the slope tells you its own identity.
On the velocity-time graph above, rise is in m/s and run is in s, so the slope carries units of (m/s)/s = m/s² — the units of acceleration. Swap the axes for a position-time graph and the slope becomes m/s, which is the object's velocity. The arithmetic is identical; the meaning is dictated entirely by the axis units. Get into the habit of writing the units at every step and you'll never confuse which quantity you've found.
What the Slope Means on Each Physics Graph
The same rise-over-run move unlocks a different quantity depending on what you plotted. This table is worth memorising — it covers the graphs that show up most often in AP, A-level, and intro university courses:
| Graph (y vs x) | Slope Represents | Units |
|---|---|---|
| Position vs time | Velocity | m/s |
| Velocity vs time | Acceleration | m/s² |
| Force vs extension | Spring constant (k) | N/m |
| Voltage vs current | Resistance | Ω (ohms) |
| Momentum vs time | Force | N |
| Charge vs time | Current | A |
The force-extension row is one of the cleanest experiments to try this on. Hang masses from a spring, plot the force against the extension, and the slope is the spring constant straight out of Hooke's law, F = kx. A stiffer spring gives a steeper line. If you want to check your readings against the formula, the spring force calculator works the same F = kx relationship from the other direction. The voltage-current row is just as tidy: because Ohm's law says V = IR, the slope of a V-I plot is the resistance in ohms.
Scattered Data? Don't Use Two Points — Use a Best-Fit Line
Real measurements never land perfectly on a straight line. Suppose you stretch a spring and record force at five extensions: (0.10 m, 2.1 N), (0.20 m, 4.3 N), (0.30 m, 5.9 N), (0.40 m, 8.2 N), (0.50 m, 9.8 N). Pick two points and you might get k = 19 N/m from one pair and k = 21 N/m from another — which is “right”? Neither. The honest answer uses every point at once through a least-squares best-fit line, which is exactly what this calculator's best-fit mode does. For that data set it returns a slope near 19.2 N/m with an R² of about 0.997.
That R² value is the part students skip and graders love. It runs from 0 to 1 and tells you how tightly the points hug the line. Above 0.98 is a convincingly linear relationship; below 0.95 and you should suspect either a non-linear effect or one bad data point. A best-fit slope without an R² is half an answer — it states a number but says nothing about whether a straight line was ever the right model.
When the Graph Curves: Average vs Instantaneous Slope
A straight line has one slope everywhere. A curve doesn't. On a position-time graph that bends upward, the object is accelerating, and its velocity — the slope — is different at every instant. Two points on a curve give you the average slope between them, which is the average velocity over that interval. To get the instantaneousvelocity at a single moment, you draw a tangent line that just grazes the curve at that point and measure the tangent's slope instead.
Here's the practical version of that idea: the closer together your two points are, the closer the average slope gets to the instantaneous slope. That's the entire concept of a derivative, sneaking in through the back door of a physics graph. For a curved velocity-time graph, the slope is still acceleration — it's just an acceleration that changes with time, and the connection back to force runs through Newton's second law, F = ma.
Four Slope Mistakes That Cost Real Marks
- Reading off data points instead of the line.When you've drawn a best-fit line, take your two points from the line, not from your scattered measurements. A single measured point that's slightly off the line will skew your slope.
- Flipping rise and run.Slope is rise over run, not run over rise. Invert it and a velocity of 4 m/s becomes 0.25 s/m, which isn't even the right kind of quantity. The units will warn you if you check them.
- Forgetting the negative sign.A line that falls from left to right has a negative slope. On a velocity-time graph that means deceleration. Dropping the sign turns “slowing down” into “speeding up.”
- Confusing slope with area.Slope and the area under the curve answer different questions. On a velocity-time graph the slope is acceleration but the area is displacement — never the same number, never interchangeable. If you need both at once, the physics graph analyzer reads the slope, area, and intercept off a single data set.
When Slope Stops Being the Right Tool
Slope assumes a straight-line relationship, and plenty of physics isn't straight. A filament lamp's voltage-current graph curves because the wire heats up and its resistance climbs — so there's no single “the resistance,” only a resistance at each point. A spring stretched past its elastic limit stops obeying F = kx, and the force-extension graph bends over; the slope beyond that point is meaningless as a spring constant.
When a relationship is a power law or exponential, the trick is to straighten it before taking a slope. Plotting the logarithm of each axis turns y = axⁿ into a straight line whose slope is the exponent n — a standard move for radioactive decay and terminal-velocity experiments. And when you genuinely need the area beneath a line rather than its steepness — displacement from a velocity-time graph, or work from a force-displacement graph — slope is the wrong tool entirely, and you reach for the area under a curve calculator to integrate instead.