Physics Graph Analyzer: How to Find Slope, Area, and Intercepts on Any Graph
Hand two students the same velocity-time graph and ask one for the acceleration and the other for the distance travelled, and they should do two completely different things to the same line. Knowing how to calculate slope in physics gets you the first answer; measuring the area underneath gets you the second. A single graph isn't one number waiting to be read — it's three: a slope, an area, and an intercept, each answering a different physical question. The trouble is that most students grab whichever one they remember and hope it's the right tool.
Three Questions, One Line: Slope, Area, and Intercept
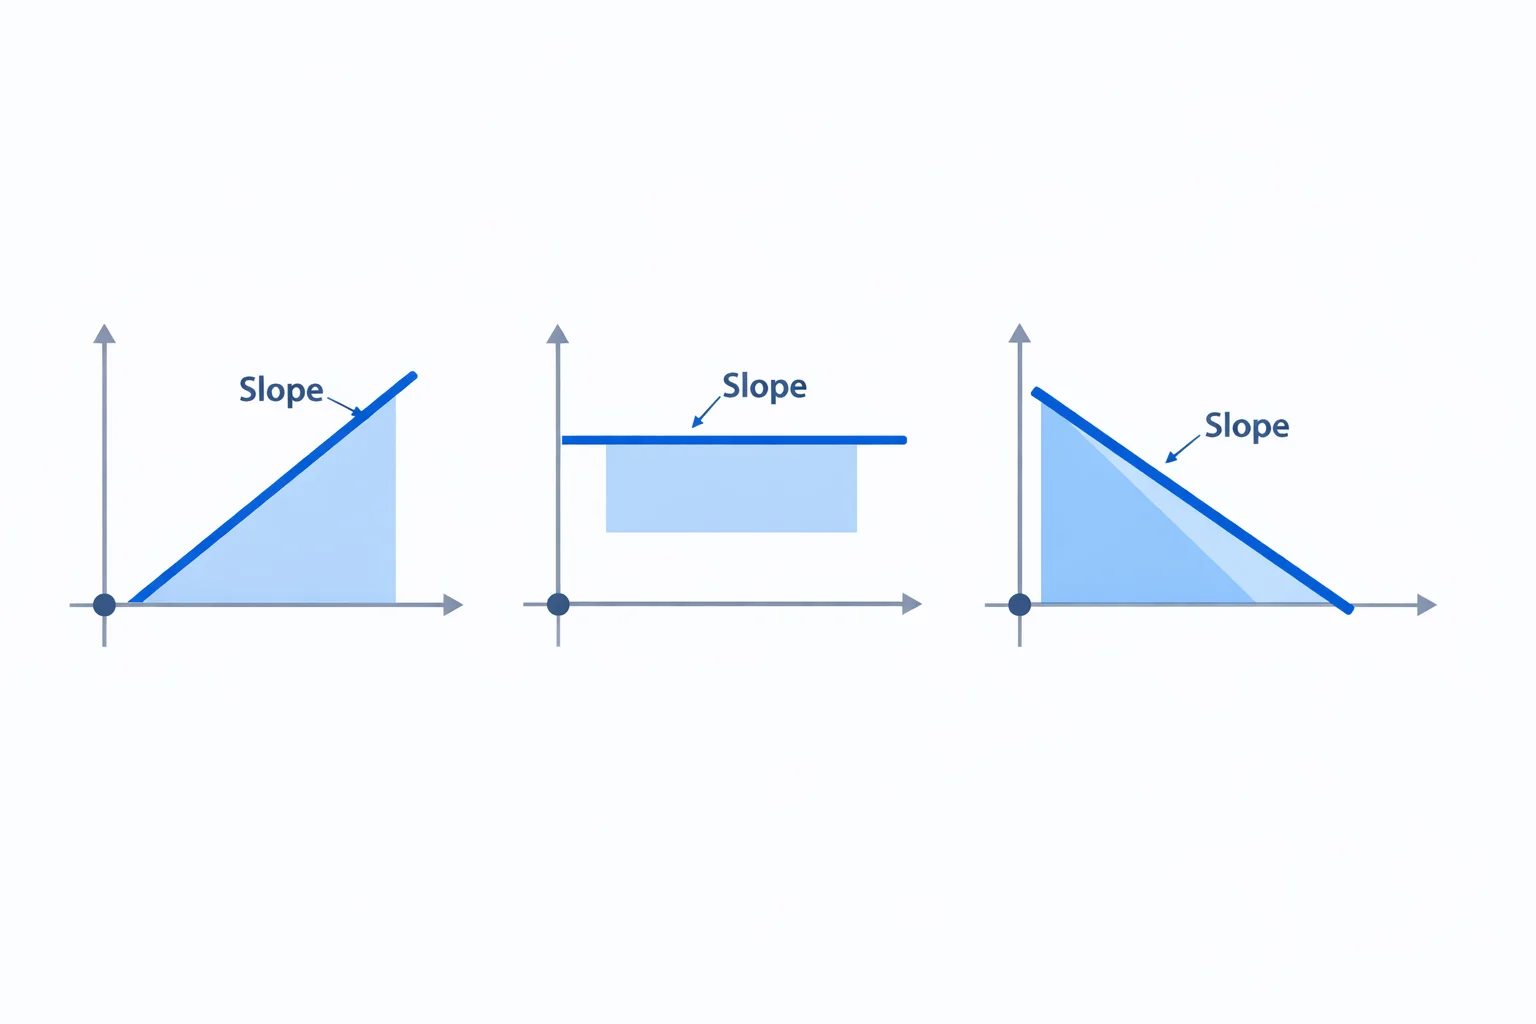
Every straight or curved line on a physics graph hides three separate measurements. The slopetells you a rate — how fast the y-quantity changes per unit of x. The area under the line tells you an accumulated total — what builds up as you sweep across x. The intercepttells you a starting value — where the y-quantity sat before x got going. They're not different ways of describing the same thing; they're three genuinely different operations that happen to live on the same picture.
Take a velocity-time graph for a car. Its slope is the acceleration in m/s². The area beneath it is the displacement in metres. The y-intercept is the velocity the car already had at t = 0. One line, three answers, three units. If you only ever learned to find the slope, this analyzer surfaces the other two for free, and labels each with the physical quantity it represents for the graph type you choose.
Why the Slope and the Area Never Mean the Same Thing
Here's the distinction that trips people up: slope is a division and area is a multiplication. Slope divides a y-change by an x-change, so its units are y-units per x-unit. Area multiplies a y-value by an x-width, so its units are y-units timesx-unit. On a velocity-time graph that's (m/s)/s = m/s² for the slope versus (m/s)·s = m for the area. The units alone tell you they can never be the same quantity.
| Feature | Slope | Area Under the Curve |
|---|---|---|
| Question it answers | How fast is y changing? | How much y has accumulated? |
| Math operation | Δy ÷ Δx (a rate) | Σ y · Δx (an integral) |
| Units (velocity-time) | m/s² (acceleration) | m (displacement) |
| Effect of a steeper line | Bigger slope value | No direct effect |
| Effect of a wider x-range | No direct effect | Bigger area |
If you want a deeper walkthrough of the slope half on its own — rise over run, choosing points far apart, the R² of a best-fit line — the dedicated slope of a graph calculator drills into just that operation. This analyzer is for when you need the slope and the area side by side.
Pulling Acceleration and Displacement off One Velocity-Time Graph
Suppose a sprinter's velocity is logged every second: 2.0, 4.1, 5.9, 8.2, 9.8, and 12.1 m/s at t = 0 through 5 s. That's the default data in the calculator above. Two questions, two tools.
Acceleration (the slope).The best-fit line through those six points has a slope of about 2.0 m/s². So the sprinter is gaining roughly 2 metres per second of speed every second. The y-intercept comes out near 2.0 m/s — the speed they were already carrying when timing began, not a standing start.
Displacement (the area).Now sum the area under the line using trapezoids between each pair of readings. From 0 to 1 s the strip is ½·(2.0 + 4.1)·1 = 3.05 m. Add the next four strips and you get a total displacement of about 40 m over the five seconds. Notice that the slope answer (2.0 m/s²) and the area answer (≈40 m) came from the same six numbers but mean entirely different things — one is how quickly speed changed, the other is how far the sprinter ran.
What Each Reading Becomes on Different Graphs
Switch the graph type and the arithmetic stays identical — only the physical meaning changes, because the axis units change. This table covers the graphs that turn up most in AP, A-level, and intro university courses, and it's the heart of what this analyzer automates:
| Graph (y vs x) | Slope means | Area means | y-intercept means |
|---|---|---|---|
| Velocity vs time | Acceleration (m/s²) | Displacement (m) | Initial velocity (m/s) |
| Acceleration vs time | Jerk (m/s³) | Change in velocity (m/s) | Initial acceleration (m/s²) |
| Position vs time | Velocity (m/s) | No standard meaning | Initial position (m) |
| Force vs displacement | Force gradient (N/m) | Work done (J) | Force at x = 0 (N) |
| Force vs time | Rate of force (N/s) | Impulse (N·s) | Initial force (N) |
| Voltage vs current | Resistance (Ω) | No standard meaning | Offset voltage (V) |
| Power vs time | Rate of power (W/s) | Energy transferred (J) | Initial power (W) |
The force-displacement row is the one worth committing to memory, because it's where slope and area each carry their full weight. The slope is the stiffness of whatever you're pushing, and the area is the work done on it — literally the energy you transferred. For a spring that obeys Hooke's law, that triangular area equals ½kx² of stored elastic energy. The voltage-current row is just as tidy on the slope side: because Ohm's law gives V = IR, the slope of a V-I plot is the resistance in ohms, while its area means nothing useful — which is exactly why the analyzer greys that reading out.
The Intercept Is More Than Where the Line Starts
The y-intercept gets dismissed as “just where the line crosses the axis,” but it's often the most physically loaded number on the graph. On a velocity-time graph it's the initial velocity: a line that starts at 5 m/s and climbs describes an object that was already moving, not one released from rest. Misread that intercept as zero and every kinematics calculation downstream inherits the error.
The x-intercept matters too, and it's easy to compute once you have the best-fit line: set y = 0 and solve x = −intercept ÷ slope. On a velocity-time graph the x-intercept is the instant the object is momentarily at rest — the turning point of a ball thrown straight up, for example. The analyzer reports both intercepts, so you can read “when did it start” and “when did it stop” without re-deriving anything.
Why Trapezoids Beat Counting Squares for Area
The old textbook method for area under a curve is counting grid squares and guessing at the partial ones. It works, but it's slow and imprecise. The trapezoidal rule is faster and far more honest: connect each pair of neighbouring data points with a straight segment, treat the strip beneath as a trapezoid, and add up the strip areas. Each trapezoid is ½·(y₁ + y₂)·Δx, and the analyzer sums them across your whole data set. If the area is the only reading you need — and you want to compare it against left and right rectangle sums or Simpson's rule — the dedicated area under a curve calculator breaks the integration down method by method.
One thing to watch: trapezoids approximate any curving between points. If a velocity-time graph bows upward, the straight segments cut the corner and slightly overestimate the area; if it bows downward, they underestimate it. The remedy is more data points — halving the spacing roughly quarters the error. And because the rule tracks signed area, a velocity that dips below zero contributes a negative strip, which is precisely what you want: the result is net displacement, not total distance.
Where Graph Reading Quietly Goes Wrong
- Using slope when the question wants area.Asked for the distance covered, plenty of students confidently report the acceleration instead. They're different operations on the same line — distance is the area, acceleration is the slope.
- Reading the intercept as the rate. A velocity-time graph starting at 8 m/s does not have an acceleration of 8 m/s². The intercept is the starting speed; the acceleration is the slope, which could be anything.
- Ignoring the sign of the area.When the curve drops below the x-axis, that area is negative. Add the magnitudes blindly and you'll get total distance when the question asked for net displacement — two genuinely different numbers whenever the object reverses direction.
- Taking the area where it has no meaning.The area under a position-time graph or a voltage-current graph isn't a standard physical quantity. Computing it isn't wrong arithmetic, but reporting it as if it meant something is.
When a Straight-Line Reading Lies to You
The slope and intercept readings assume a straight line, and a low R² is your warning that the assumption is shaky. A filament lamp's voltage-current graph curves because the wire heats up and its resistance climbs, so there's no single “the resistance” — only a slope that changes at every point. A spring stretched past its elastic limit stops obeying F = kx, and the best-fit slope beyond that point is meaningless as a spring constant. Watch the fit quality before trusting a single slope number.
The area reading is more forgiving — trapezoids follow the real points whether the data is straight or curved — but it still needs the integral to mean something physical. When you genuinely need the area under a force-displacement curve, that's the work done, and once you know the final speed from a velocity-time graph you can carry it straight into a kinetic energy calculation with KE = ½mv². Read the graph for what it's good at, and hand the number off to the right formula from there.