Graph & Data Analysis Calculators — Slope, Area & Intercepts
Find the slope, area under a curve, and intercepts from physics graphs. Analyze velocity-time, force-displacement, and energy data from lab experiments.
Graph & Data Analysis Calculators
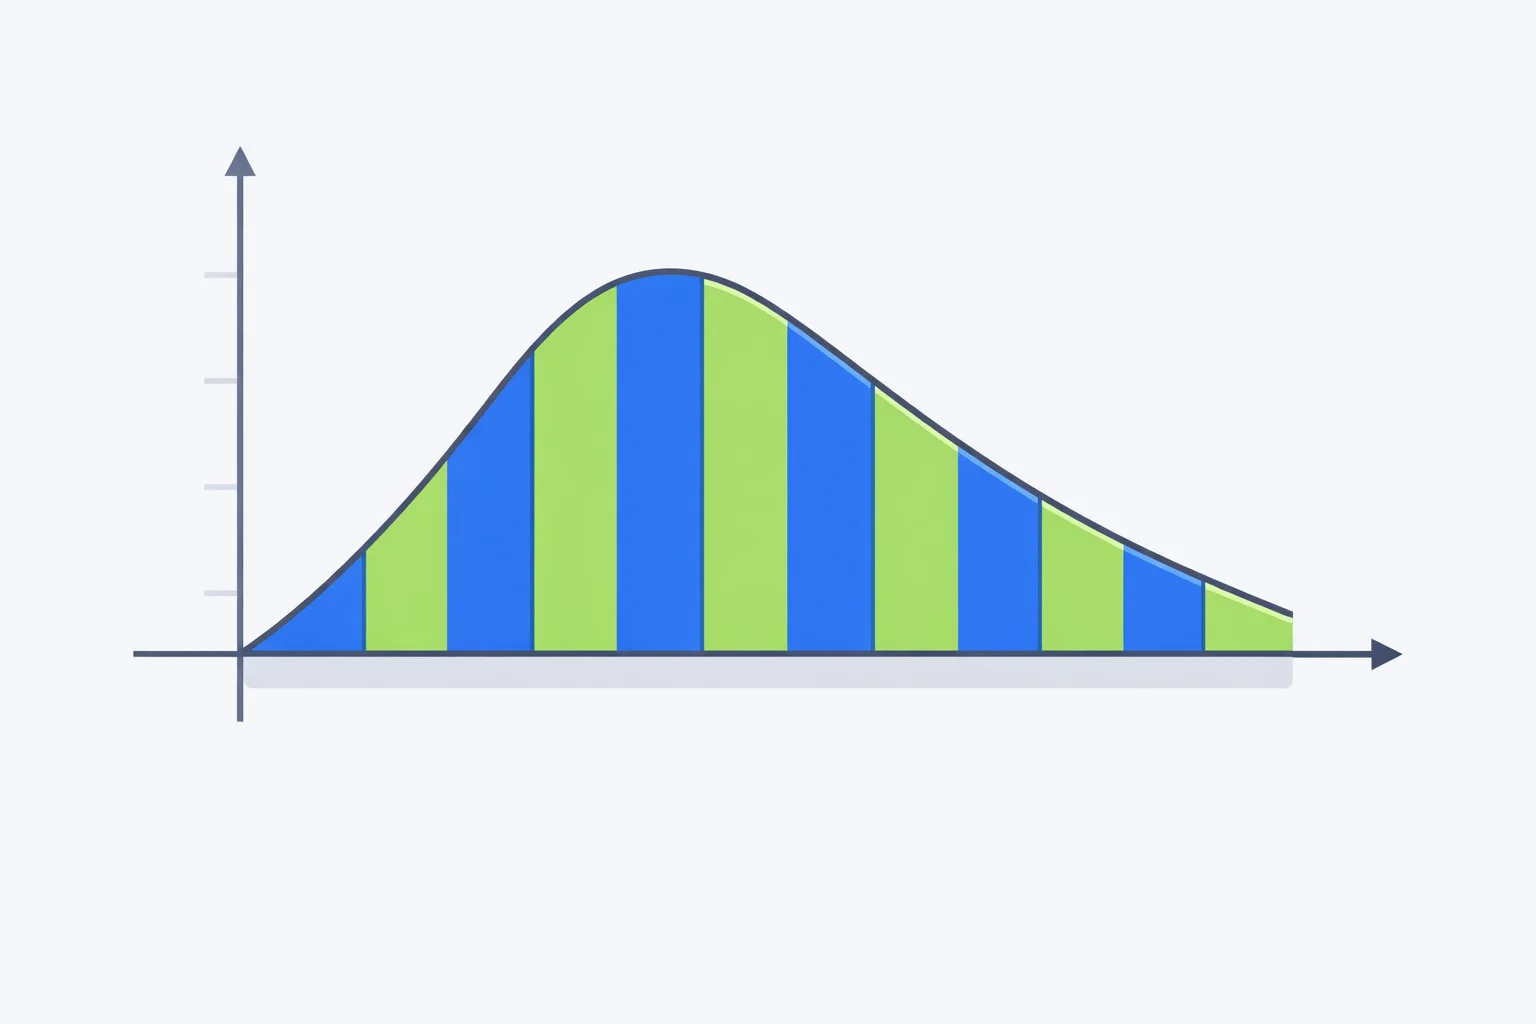
Area Under a Curve Calculator
Calculate the area under a physics graph to find displacement, work, or impulse. Compare trapezoidal, rectangular, and Simpson's methods for any dataset.
Use Calculator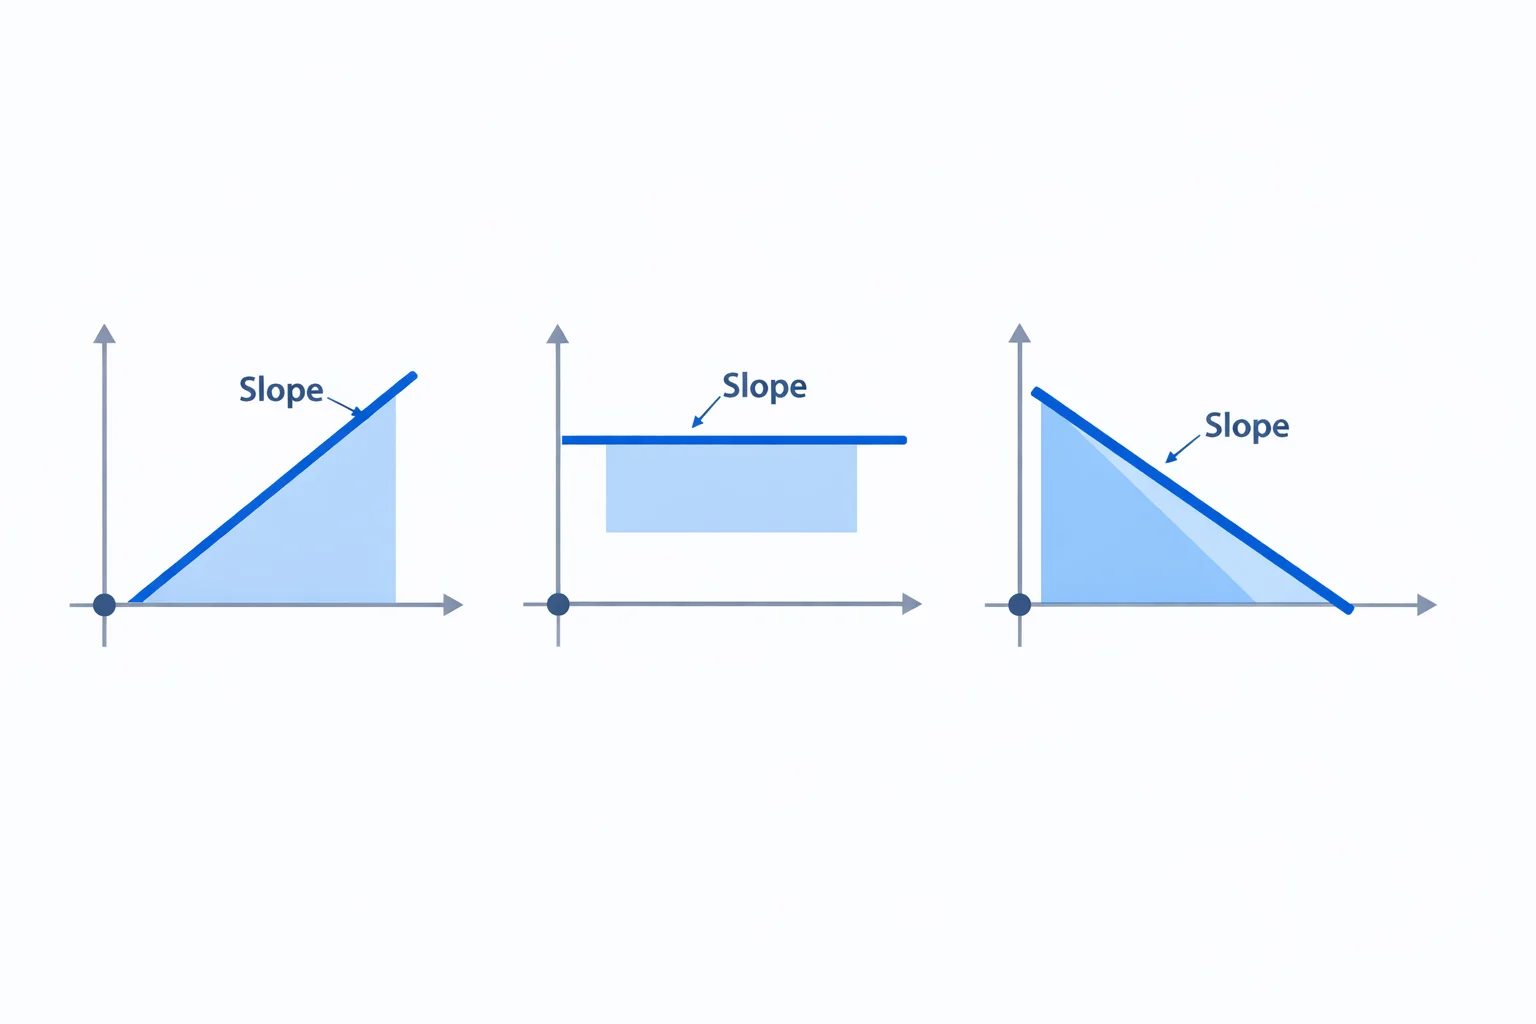
Physics Graph Analyzer
Read slope, area under the curve, and intercepts off any physics graph at once. Get acceleration, displacement, work, impulse, and resistance with a best-fit line and R².
Use Calculator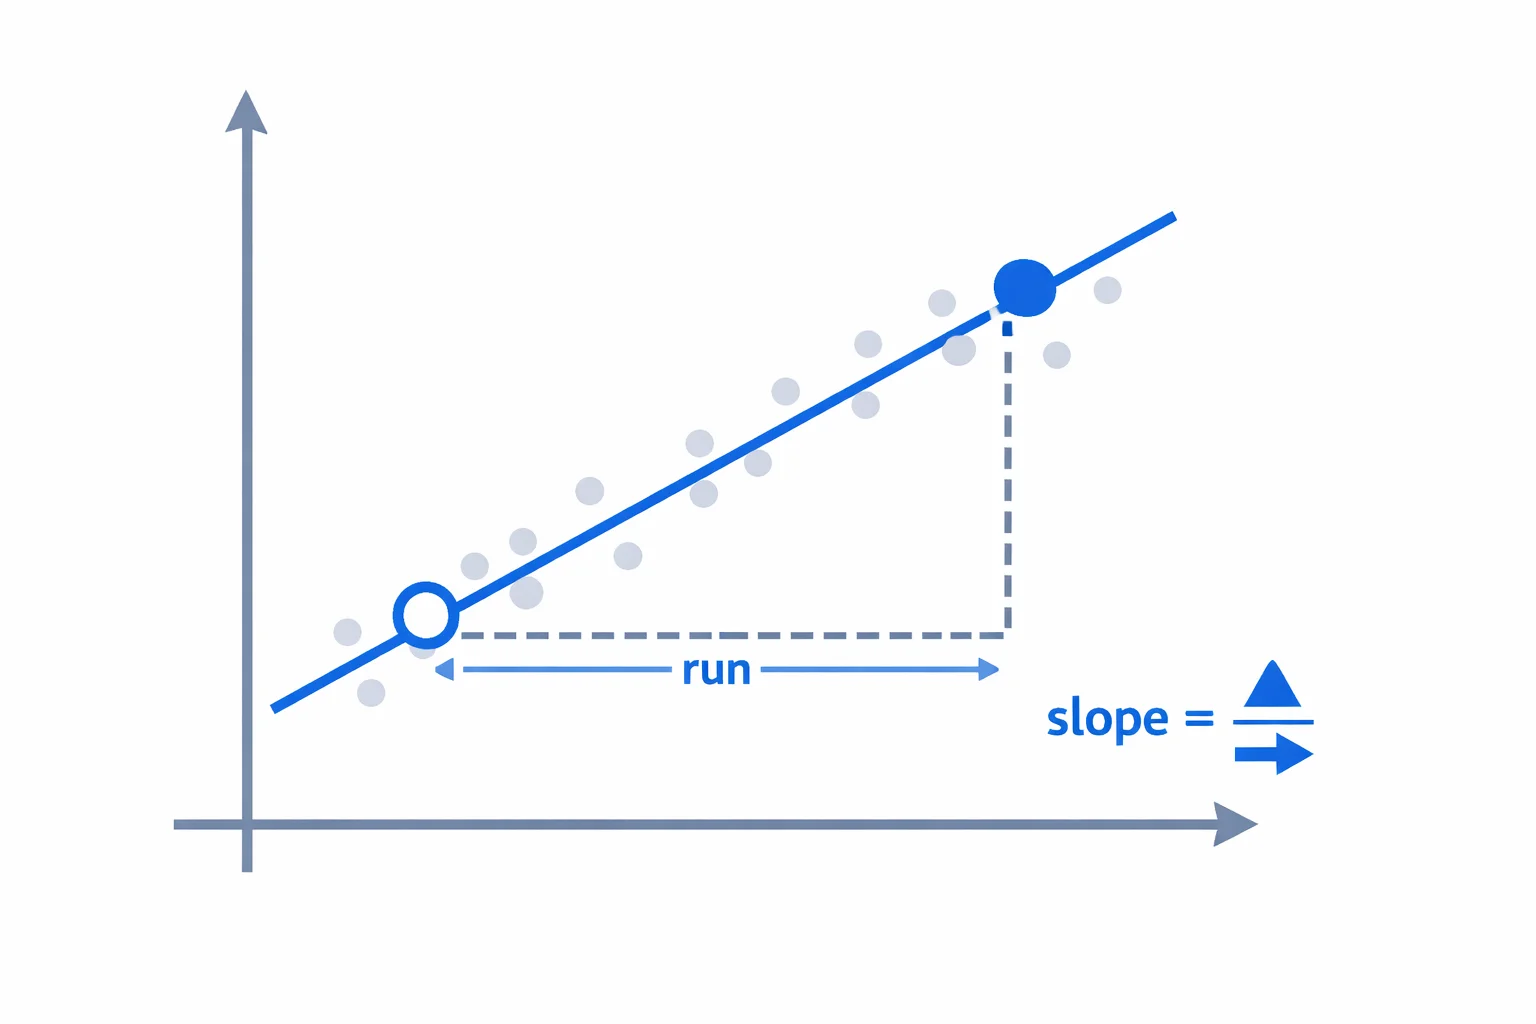
Slope of a Graph Calculator
Find the slope of any physics graph from two points or a full data set. Get velocity, acceleration, spring constant, or resistance with a best-fit line and R².
Use CalculatorUnderstanding Physics Graphs & Data
Graphs are the primary tool physicists use to visualize relationships between variables and extract quantitative results from experimental data. The slope of a position-time graph gives velocity, and the slope of a velocity-time graph gives acceleration. The area under a velocity-time graph equals displacement, while the area under a force-displacement graph equals work done. Mastering these interpretations turns raw data into physics insight.
Data analysis in physics goes beyond reading points off a graph. You need to determine whether a relationship is linear (y = mx + b), quadratic (y = kx²), or inverse (y = k/x), and then linearize the data to extract constants. For example, plotting period² vs. length for a pendulum yields a straight line whose slope equals 4π²/g, letting you determine gravitational acceleration from experimental data.
Graph analysis is inseparable from kinematics, where position-time and velocity-time graphs are the standard way to represent motion. Combining graphical techniques with measurement & uncertainty analysis — including error bars and slope uncertainty — lets you draw rigorous conclusions from imperfect experimental data.