Relative Uncertainty: The Dimensionless Ratio That Lets You Rank Any Two Measurements
Here's a question you can't answer with your eyes: in a density experiment you measured a length of 2.40 cm ± 0.05 cm, a mass of 48.6 g ± 0.1 g, and a time of 12.0 s ± 0.2 s. Which measurement is the weakest — the one quietly limiting your final result? The ± figures are useless for this; ±0.05 cm and ±0.1 g aren't even in the same units, so comparing them is like asking whether a kilogram is heavier than a kilometre. This is exactly the gap relative uncertaintyfills. Divide each error by its own reading and the units vanish, leaving a bare ratio — δx/|x| — that you can line up against any other measurement on Earth. It's also called fractional uncertainty, and once you have it, the answer to the density question falls out in a single glance.
Relative Uncertainty Is a Pure Ratio, Not a Quantity
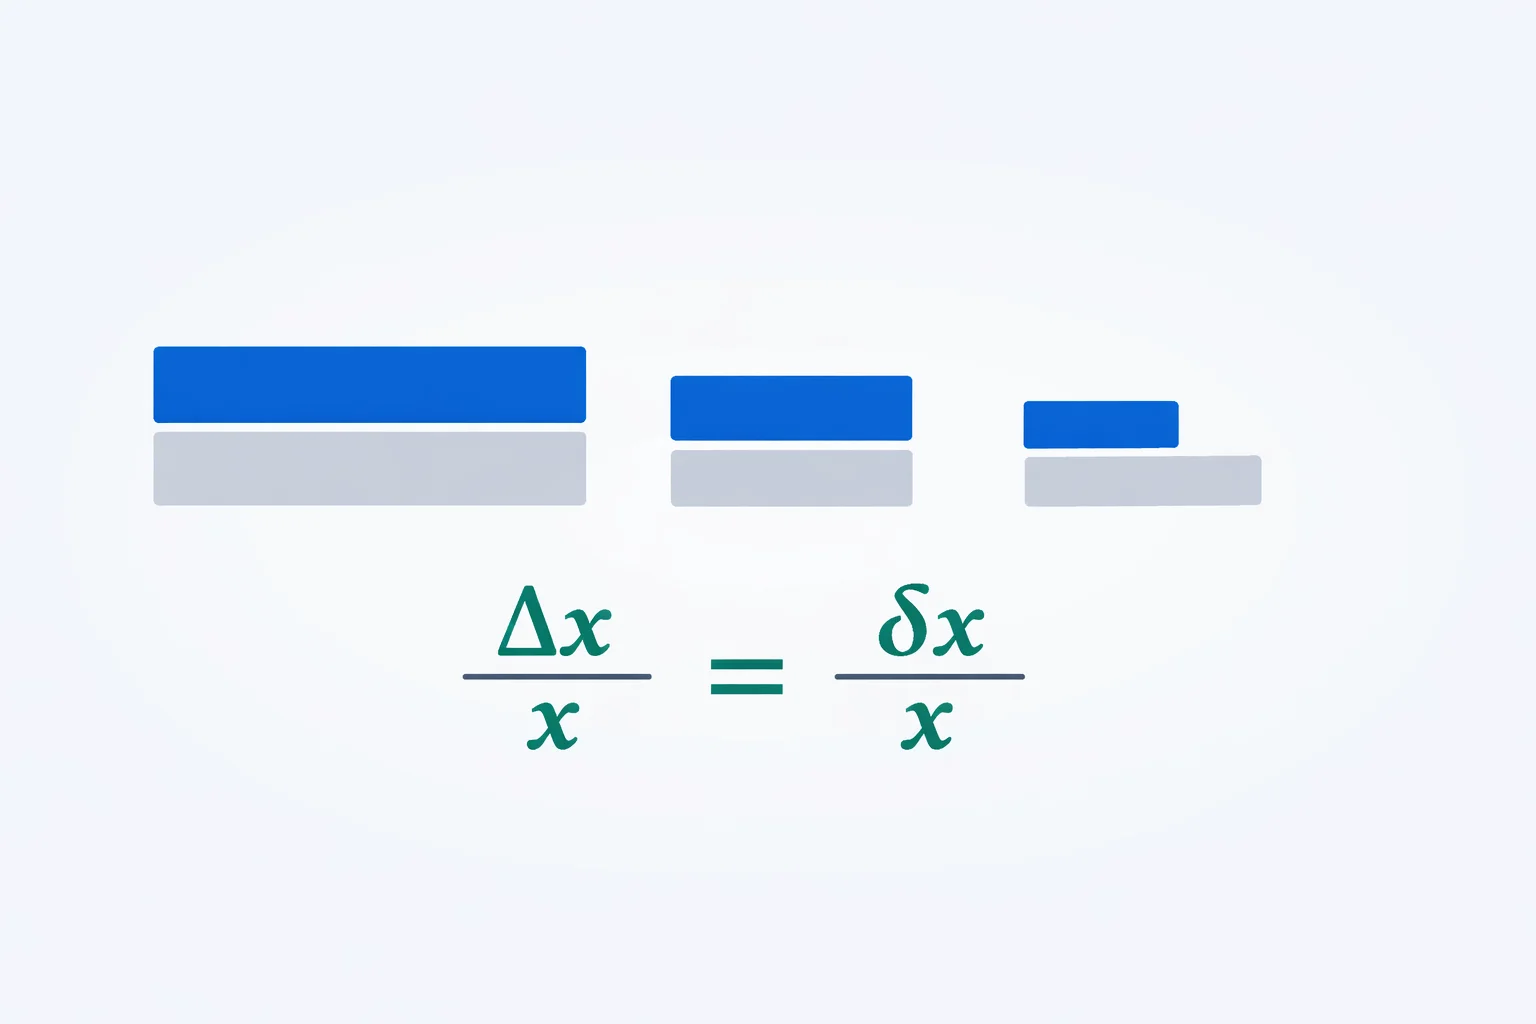
The formula is the simplest in all of error analysis: r = δx / |x|. Take the absolute uncertainty δx, divide by the size of the reading, and you're done. A length of 2.40 cm ± 0.05 cm gives 0.05/2.40 = 0.021. Notice what happened to the units — centimetres over centimetres cancel, so the result is just a number. That cancellation is the entire point. A ±0.05 cm can only be compared to another length, but the ratio 0.021 can be compared to a mass, a voltage, or a half-life. Relative uncertainty strips a measurement down to one quality — how sharply it pins down its own value — and throws away everything else.
People reach for it under three names, and the names hint at how to read the number. "Relative" says it's measured relative to the value. "Fractional" says it's a fraction of the reading. Multiply by 100 and you get percent uncertainty, the same ratio dressed up for a lab report. Decimal, fraction, percentage — pick whichever a question asks for. They carry identical information.
Solving the Weak-Link Problem Step by Step
Back to those three measurements. Work out the ratio for each and the contest is over fast. The length: 0.05/2.40 = 0.021, or 2.1%. The mass: 0.1/48.6 = 0.0021, or 0.21%. The time: 0.2/12.0 = 0.017, or 1.7%. Ranked from sharpest to weakest, the mass (0.21%) wins by a mile, the time (1.7%) sits in the middle, and the length (2.1%) is the weak link. The balance is doing fine; the ruler is the bottleneck.
That ranking changes what you do next. There's no point buying a better balance — the mass is already ten times more precise than the length. If you want a tighter density, re-measure the length with calipers instead of a ruler, dropping its ±0.05 cm toward ±0.005 cm and its ratio toward 0.2%. One swap fixes the dominant error. This is the move that separates a thoughtful experimenter from one who measures everything to death: relative uncertainty tells you precisely where the precision is leaking, so you spend effort only where it pays. Drop your own numbers into the Compare mode above and the red "weak link" bar names the culprit for you.
One Number, Five Ways to Write It
A single relative uncertainty can be written half a dozen ways, and different fields prefer different forms — engineers like percent, frequency labs quote parts per million, and a fast mental check is often easiest as "1 in N" odds. They're all the same ratio. This table lines them up so you can translate at a glance:
| Decimal | Percent | As "1 in N" | ppm | Sig figs justified |
|---|---|---|---|---|
| 0.1 | 10% | 1 in 10 | 100,000 | ~1 |
| 0.01 | 1% | 1 in 100 | 10,000 | ~2 |
| 0.001 | 0.1% | 1 in 1,000 | 1,000 | ~3 |
| 0.0001 | 0.01% | 1 in 10,000 | 100 | ~4 |
| 0.000001 | 0.0001% | 1 in 1,000,000 | 1 | ~6 |
The ppm column isn't academic. A cesium atomic clock holds time to a relative uncertainty near 10⁻¹⁵; a good quartz watch manages about 10⁻⁶, one part per million, which is why it drifts roughly a second a fortnight. Same ratio, same calculator — just a column further right.
The Ratio Decides How Many Digits You're Allowed
Look hard at that last column, because it hides the most useful trick relative uncertainty offers: the ratio sets a hard ceiling on how many significant figures you may honestly write. The rough rule — count the leading zeros after the decimal point in the ratio, then add one. A relative uncertainty of 0.01 (one leading position) earns about 2 significant figures; 0.001 earns about 3. So if you measure g and your data is good to 1%, writing g = 9.8124 m/s² is fiction — the ratio entitles you to 9.8 m/s², two figures, because the third digit is already swamped by your ±0.1 m/s² of doubt. Extra digits don't add precision; they advertise that you never checked your own uncertainty. The significant figures calculator will round a value down to the digits its ratio actually supports.
Multiply Quantities and the Fractions Add
Relative uncertainty isn't only for comparing — it's the form errors travel in when you multiply or divide. For any product or quotient, the fractional uncertainties add. Find a resistance from R = V/I with a voltmeter reading 6.0 V ± 0.1 V and an ammeter reading 0.50 A ± 0.01 A. The voltage's ratio is 0.1/6.0 = 0.017; the current's is 0.01/0.50 = 0.020. Add them and R carries 0.037, about 3.7%. The resistance itself is 6.0/0.50 = 12 Ω, so its absolute uncertainty is 12 × 0.037 ≈ 0.4 Ω, and you report R = 12.0 ± 0.4 Ω. The ammeter, with the slightly larger fraction, is the weak link — tighten it first.
That add-the-fractions rule is the reason physicists convert to a ratio at all: absolute uncertainties in volts and amps can't be added, but two unitless fractions can. The rule covers products, quotients, and powers (a squared term doubles its fraction). It does not cover sums and differences — there you switch back to adding absolute uncertainties. To run several quantities through a whole formula at once, the uncertainty calculator applies these rules automatically, and the error propagation calculator adds them in quadrature for independent random errors.
When the Ratio Lies to You
Relative uncertainty has two failure modes worth knowing before you trust it. The first: it blows up as the measured value approaches zero, because you're dividing by that value. A fixed ±0.5 mm is a comfortable 0.001 on a 500 mm rod but a catastrophic 0.25 on a 2 mm gap — same error, 250 times the ratio. The cure is a finer instrument, not steadier hands. The second failure is sneakier: subtracting two nearly equal numbers can push the ratio past 1. Measure a coin's thickness as a 50.8 mm ± 0.1 mm stack minus paper at 50.2 mm ± 0.1 mm, and the coin is 0.6 mm with an absolute ± of 0.2 mm — a relative uncertainty of 0.33, a third of the value, from two readings each better than 0.2%. Once the ratio climbs above 1 the measurement can't even confirm its own sign, which is your cue to redesign the experiment, not the spreadsheet. And keep the rule's scope in mind: relative uncertainty is for multiplying, dividing, and comparing — never for adding or subtracting, where the units have to stay on.
Mistakes That Quietly Inflate the Fraction
- Comparing ± figures instead of ratios. ±0.1 g and ±0.1 s tell you nothing about which measurement is more precise. Convert both to relative uncertainty first — only then is the comparison meaningful.
- Mixing up the ratio and the percentage. A relative uncertainty of 0.02 is 2%, not 0.02%. Forgetting the ×100, or applying it twice, is a hundred-fold error examiners spot instantly.
- Adding fractions across a subtraction. Fractional uncertainties add for × and ÷ only. For a difference, add the absolute uncertainties and convert to a ratio at the very end.
- Quoting more digits than the ratio allows. A 1% relative uncertainty supports two significant figures. Writing five is claiming a precision the measurement never had.
- Trusting a ratio built on a tiny denominator. If you got there by subtracting two close numbers, the fraction can be huge even when both readings were excellent. Glance at how the value was formed before you believe the percentage.
For the formal definitions metrology labs use — how relative standard uncertainty is defined and reported worldwide — the NIST reference on measurement uncertainty is the authoritative source behind the conventions in this guide.