Physics Regents Score Calculator: Why a 65 Isn't 65% (and What Your Raw Credits Really Convert To)
Every June, students walk out of the Physical Setting/Physics exam, add up the questions they think they got right, divide by 85, and panic at a number in the fifties. Most of them passed. The single most persistent misconception about this exam is that the score on your transcript is a percentage — it isn't. This physics regents score calculatorapplies the thing your mental arithmetic skips: the raw-to-scaled conversion chart, which in recent June administrations has turned roughly 46-49 of 85 raw credits (about 55%) into the scaled 65 New York calls passing. The chart is nonlinear, it changes with every administration, and it's the reason two students with the same raw score in different years can carry different numbers on their transcripts. Here's how the conversion actually works.
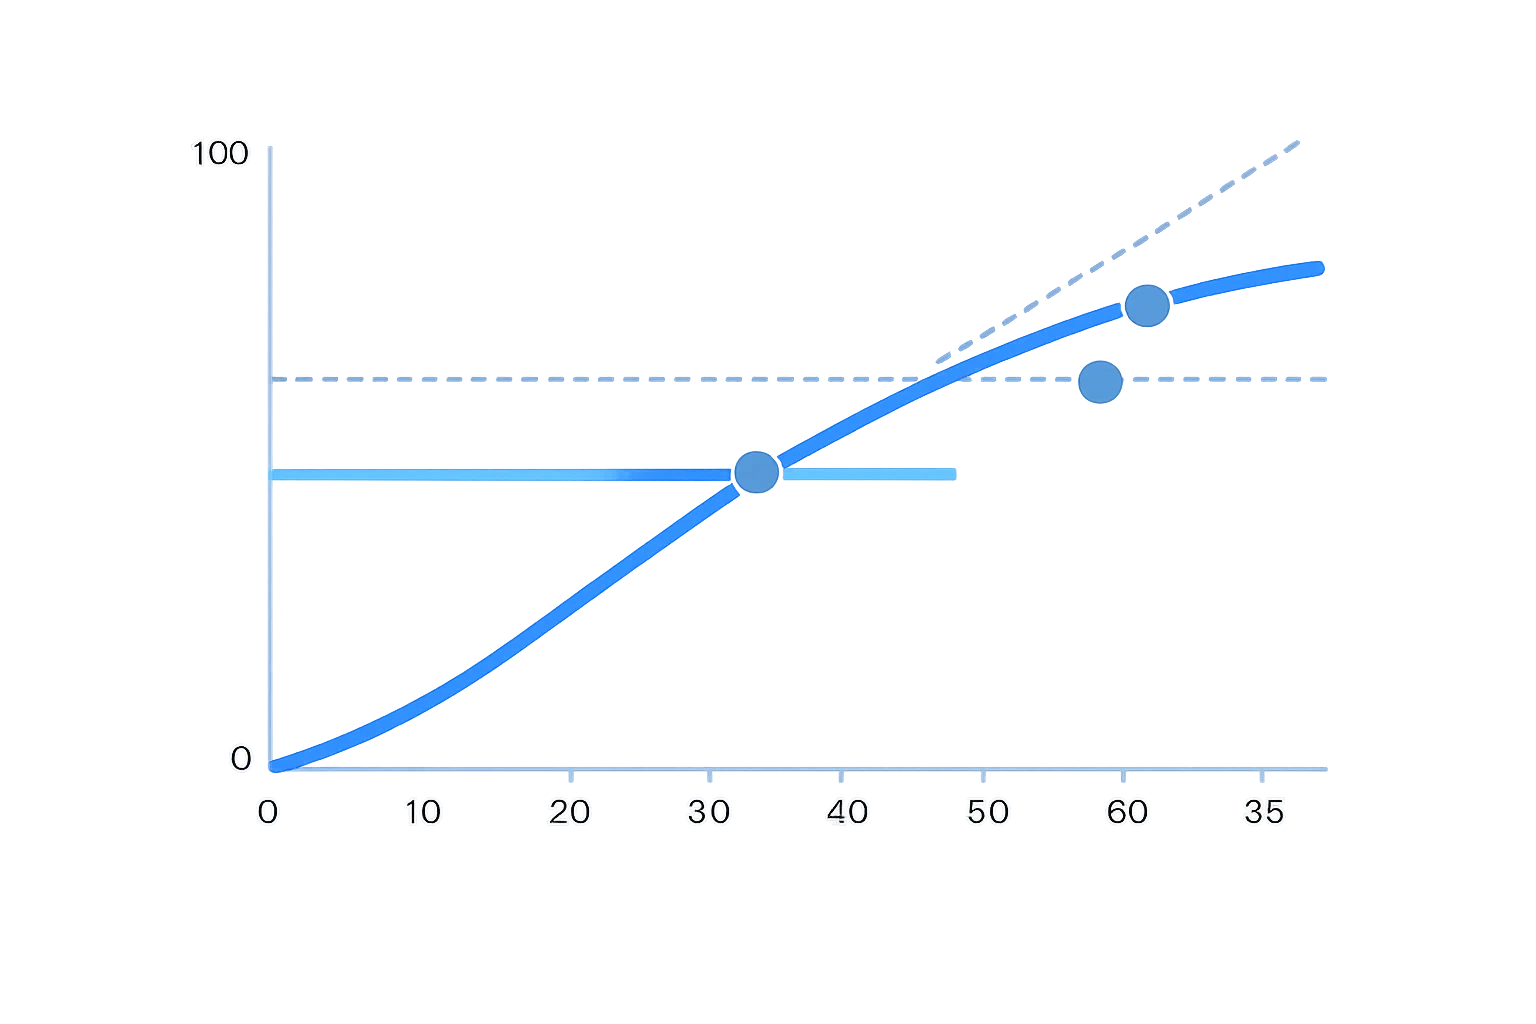
A 65 Isn't 65%: What the Scaled Score Actually Measures
The Physics Regents awards a maximum of 85 raw credits. Your transcript, though, reports a scaled score from 0 to 100 — and the two scales only agree at the endpoints. NYSED publishes a conversion chart with each administration that maps every raw score to its scaled equivalent, and that chart bows well above the straight-percentage line for most of its length. On a typical June chart, 47 raw credits (55.3%) scales to 65. A raw 58 (68.2%) scales to about 73. Only at the very top does the gap close: 85 raw credits is a scaled 100, and each raw credit near the top moves the scaled score by roughly one point.
Why build it this way? Because the scaled score is meant to certify a standard, not rank a percentage. The exam includes multi-step problems where even strong candidates shed credits — a Part C projectile question might award 1 credit for the equation, 1 for substitution with units, and 1 for the answer, and dropping the units costs you a third of the value even with perfect physics. The conversion chart compensates for that structural harshness so that "65 = meets the standard" means the same thing on a brutal form and a gentle one.
Where the 85 Raw Credits Live: Parts A Through C
The exam splits its 85 credits into four parts, and the split matters for strategy because half the exam is machine-scored multiple choice with no guessing penalty:
| Part | Format | Credits | What it rewards |
|---|---|---|---|
| Part A | Multiple choice | 35 | Breadth — one question can jump from waves to circuits to kinematics |
| Part B-1 | Multiple choice | 15 | Graph reading and Reference Table fluency |
| Part B-2 | Constructed response | 15 | Short written work — equations, substitutions with units, sketched graphs |
| Part C | Extended constructed response | 20 | Multi-step problems in lab-style contexts, scored credit by credit |
Two consequences fall out of this table. First, Parts A and B-1 together hold 50 of the 85 credits — enough that a perfect multiple-choice performance alone converts to roughly a scaled 67 on a typical chart. Nobody should plan around that, but it tells you where the fastest credits are. It also means a wrong bubble and a blank bubble are identical here, both worth zero — unlike the old College Board Subject Tests, where the SAT Physics score calculator has to subtract a quarter credit for every wrong answer. Second, the written parts run on partial credit: the scorer follows a rubric that pays out for each correct step. Writing the guess-free skeleton of a solution — equation, known values with units — routinely salvages 1-2 credits on a problem you can't finish, and 4-5 salvaged credits is a scaled-point swing of 3-4 near the passing line.
Worked Example: 58 Raw Credits on Three Different Charts
Say a practice exam gives you 24/35 on Part A, 9/15 on B-1, 12/15 on B-2, and 13/20 on Part C — a raw total of 58 credits, or 68.2%. A student reading that as a percentage sees a D-plus. Run it through actual conversion behavior instead:
- On a typical June chart, raw 58 scales to about 73
- On a generous chart (issued when the form ran hard), it reaches about 75
- On a strict chart (an easier form), it drops to about 72
Same 58 credits, a 3-point scaled spread, and every version is comfortably passing — nowhere near the 68% the raw percentage suggested. Notice how tight that spread is compared to systems that set boundaries after the fact: the IB Physics score calculator has to model an 8-point boundary swing between sessions, because the IB decides its cutoffs at a grade award meeting after grading. Regents charts move less — but they do move, which is exactly why this calculator lets you stress-test a score against three chart scenarios instead of pretending one table is permanent.
It's Equating, Not a Curve — and It's Fixed Before You Sit Down
Students call the conversion chart "the curve," and the name smuggles in a wrong idea: that your score depends on how everyone else did that day. It doesn't. A curve, strictly speaking, redistributes grades after the fact based on cohort performance. Regents conversion charts are built by equating— questions are field-tested in advance, the difficulty of each form is measured before it's ever administered, and the chart is constructed so that the scaled 65 represents the same command of physics on every form. When the June chart looks "generous," that's not mercy for a struggling cohort; it's the psychometric bill for a harder set of questions, calculated ahead of time. NYSED's archive of past Physics Regents exams publishes the official chart alongside every released form, which is what makes those forms genuinely scoreable as practice tests.
The practical upshot: you can't "hope for a good curve" by rooting for your classmates to struggle, and a hard exam doesn't doom you — the chart already knows the exam was hard. What you can control is raw credits, and near the passing line each one is worth about 1.4 scaled points, the steepest exchange rate anywhere on the chart.
The Price of an 85: Why Distinction Costs 82% Raw
The conversion chart's generosity is front-loaded, and the numbers make the point better than any description. On a typical chart, the first scaled 65 costs 47 raw credits. The next 20 scaled points — from passing to the 85 mastery line — cost about 23 more raw credits, taking you to roughly 70/85, or 82% raw. Per scaled point, the middle of the chart is the most expensive real estate on the exam:
| Scaled range | Raw credits required (typical chart) | Approx. value of one raw credit |
|---|---|---|
| 0 → 65 | 47 credits | ~1.4 scaled points |
| 65 → 85 | 23 credits | ~0.9 scaled points |
| 85 → 100 | 15 credits | ~1.0 scaled point |
This is worth internalizing if you're chasing distinction rather than survival. A student at a scaled 78 who wants an 85 needs about 8 more raw credits — nearly a full Part B-2's worth of written work — while a student at 58 raw needing to pass was only ever a few credits short. AP students will recognize the shape: the AP Physics 1 score calculator shows the same compression at the top of the composite scale, where the jump from a 4 to a 5 costs more raw points than the jump from a 3 to a 4. Standardized physics exams consistently make excellence expensive and competence achievable.
What 55, 65, and 85 Actually Unlock
The three milestone scores aren't arbitrary — each one is attached to a specific credential in New York's system, which is why the calculator flags them rather than grading on letters:
| Scaled score | Raw credits (typical chart) | Raw percentage | What it unlocks |
|---|---|---|---|
| 55 | ~36 | ~42% | Safety-net range — can count toward a local diploma for eligible students with disabilities |
| 65 | ~47 | ~55% | Passing — satisfies the physical-science slot for the Advanced Regents Diploma designation |
| 85 | ~70 | ~82% | Distinction — counts toward the annotation for mastery in science (85+ on three science exams) |
Two footnotes belong on this table. Scores a few points below 65 have historically been appealable to a Regents diploma under specific conditions — the band and requirements have shifted over the years, so treat that as a conversation with your counselor, not a plan. And New York's Board of Regents has approved phasing out the exam-passing requirement for graduation later this decade; the exams and their conversion charts continue in the meantime, and mastery designations still read well on a transcript either way.
Where This Estimate Can Miss
An honest calculator names its error bars. The first is the chart itself: the three scenarios here are modeled on published conversion charts from recent June administrations, but your administration gets its own official chart, and near a milestone a 1-2 point difference decides everything. If your predicted score sits within 2 scaled points of 65 or 85 on any scenario, consider yourself on the line. The second is self-scoring bias on the written parts: students grading their own Part B-2 and Part C work against a rubric tend to over-award their setups — "I basically had it" is not a credit. Score practice exams with the actual rubric from the released form, and when in doubt, take the lower reading. The third is coverage drift: a practice form from several years ago tests the same course, but topic emphasis shifts between forms, so one strong result on a single old exam is a weaker signal than consistent results across two or three. The arithmetic in between — raw credits in, chart applied, scaled score out — is the one part of this exam with no uncertainty at all.